Denemediğim indikatör, gösterge kalmadı..Her nekadar araştırmalarım sürsede, şu anda üzerinde zaman zaman az çok değişiklik yaptığım ve uzun zamandır kullandığım sistemin çok yararlarını görmekteyim..
Bir kodun (bist-viop-hisseler vs) grafiği nasıl incelenir..
Sırasıyla anlatacak olursam;
1- Öncelikle Lineer ve Logaritmik olmak üzere 2 tip grafiğimiz var..Aradaki farkı görmeniz açısından aynı periyot içindeki görünümlerini gösteriyorum
Fazla detaya girmeden şunu söylemek isterim..
Logaritmik grafiği 10-5 sene gibi uzun dönemlerde, Lineer i ise yakın zamanlar için kullanın..

Ana trend leri saptamak, yapacağımız teknik analizin ilk temel taşı..
Bunu beyninize kazıyın..
Dikkat edeceğimiz konu, çizeceğimiz çizginin mümkün olduğunca birçok diplerden geçiyor olmasıdır..Burada üşenmeyip çok titiz davranın.. Grafikte görülen kalın mavi trend çizgisi..
Bist 100 Günlük grafik

Aşağıda ise Bist 30 Haftalık grafik var..
Burada da mavi trend ile gösterdim..
Kuşkusuz hangi dipleri alacağımız sizlerin tercihine kalmış bir konu..Dediğim gibi mümkün olduğunca çizeceğimiz trendin en çok diplerden geçenini bulmaya çalışın..
Bu arada arada kalan trendleri, paralel kanalları çizerektende elinizi alıştırmaya bakın..

Aşağıdaki grafikte ise Önemli yatay destek ve dirençleri görmektesiniz..
Bu yatay çizgiler,
Fiyatın altında ise Destek, üzerinde ise Direnç olurlar..Yatay çizgiler ise TA nın ikinci temel taşıdır..


Sonraki incelememizlerde ise grafiklerimizde oluşan formasyonları bulmaya ve analizlerimizi zenginleştirmeye çalışıyoruz..
Burada önemli olan;
Formasyon oluşup çalıştıktan sonra " aa bu şu formasyonmuş " demek değil, en baştan oluştuğunu görüp, ona göre strateji belirlemektir..
Hani derler ya " testiyi kırdıktan sonra yol gösteren çok olur" diye..
Aşağıdaki grafiklerde işaretlediğim bazı formasyonlar var..
Formasyonlar aslında zor bir konu değil..Yeterki dikkatli bakıp bulmaya çalışalım..
Bu konu ile ilgili " Formasyonlar " bölümünü çalışıp tüm şekilleri ezberlemenizi öneririm..


3- Hareketli Ortalamalar..
Olası hareketin yönünün belirlenmesi açısından bize çok yardımcı olacak bir enstrümandır..
Hesaplama yöntemi açısından, başta basit, üssel, ağırlıklı, üçgensel olmak üzere çeşitli sınıflara ayrılırlar..Ben yerine göre hepsini kullanıp baksamda, grafiklerimde aksini belirtmedikçe hep üssel ortalamalar yer alacak ema x olarak ifade edilecek..
Burada ema nın açılımı şu: e, exponential yani üssel.. ma da Moving average (hareketli ortalama)
Grafiklerde en az 2 tane olmalı ve küçük olanın büyük olanını, aşağıdan veya yukarıdan kesme durumuna göre pozisyonlarımız ayarlanmalı.
Aşağıdaki grafikte 10 luk yeşil, 30 luk kırmızı olarak gösterilmiştir..
2 taneden daha fazla ortalama kullanmamız daha geniş alanda, ileriye dönük yorumlama yapabilmemizi sağlar..
Benim yıllardır edindiğim tecrübeye göre, her periyotta kullanmakta olduğum ortalama değerleri şunlardır.. Ağırlıklı (weighted) 8 ve Üssel (ema) 21-50-100-200
Üssel 7 ile Ağırlıklı 8 arasındaki tek fark: Ağırlıklının biraz daha hassas olması..
Platformunda Ağırlıklı seçeneği olmayan rahatlıkla üssel olanı kullanabilir..
Daha önceden sinyal almak için üssel 7 yerine , ağırlıklı 8 ve üçgensel 10 kullanılabilir..Bu ikisinin kesişmesi olayı..
Veri tipini ise D+Y+K/3 alıyorum.
Özellikle 21 lik olanı çok önemlidir..Bir fiyatın orta ve uzun dönemde düşüşe veya yükselişe geçtiğinin bir yerde teyididir.. (yatay piyasalar hariç)

Şimdi bu kullandığım ortalamaların grafik üzerinde nasıl göründüklerine bir bakalım..
Kural: En küçük olan, kendinden büyük olanları sırasıyla aşağı giderek kesiyorsa piyasa düşüyor demektir..yani 7 liğin 21-50-100-200 lükleri kesmesi..
Eğer aşağıdan yukarı doğru kesiyorsa da piyasa çıkıyor demektir..
Aşağıda kalan Ortalamalar birer destek dirler..

Yukarda kalan ortalamalar ise direnç dirler..

Özetlemek gerekirse strateji basitçe şöyle olmalı..
21 in altında SAT durumunda bekliyoruz..(Periyot sizin tercihinize bağlı)..Üzerinde ise AL durumunda..
4- İndikatörler
Bildiğiniz üzere bir çok indikatör var..Ben hepsini denedim ve sonunda Kairi de karar kıldım..
Yukardaki grafikte modifiye ettiğim Macd indikatörü ile olan benzerliğini görüyorsunuz..
Sizlere tavsiye edebilirim..Unutmayın fazla indikatör kullanılması kafa karıştırır biraz..
Kairi yi platformlarında bulamayanlar macd i kullanabilir..
Benim iDeal platformunda kullandığım parametreler bunlar..

____
Ortalamanın çekim gücü:
Aşağıdaki örneğe dikkat..Sürekli göz önünde bulundurun..
geride kalan ortalama oldumu -- özellikle en düşük olanı (7 lik)-- onun bir miknatıs etkisi olacaktır..
kural şu:
a- Fiyat ya ortalamasına gidecek ya da,
b- Fiyat ortalamasını bulunduğu yerde bekleyecek..

Son daire içinde bulunan yeşil barın sert bir çıkış sonrasında beyaz ortalamasına gittiği görülmekte..
üzerine geçsede tutunamayıp geri döndü gerçi sonrasında..

----------------------------------------------------------------------------------
Aşağıdaki sitede bilgiler ve stratejiler var..
http://www.learntotradethemarket.com/forex-trading-strategies
Beginners Introduction To Price Action Trading
 Price Action Trading Explained
- 1- The Definition Of Price Action
- 2- Trading with “Messy” Vs “Clean” Forex Charts
- 3- How to identify trending and consolidating markets
- 4- How to trade Forex with Price Action Trading Strategies
- 5- How to use chart confluence and Price Action Signals
What is Price Action ?
Basic Definition: Price Action Trading (P.A.T.) is the discipline of making all of your trading decisions from a stripped down or “naked” price chart. This means no lagging indicators outside of maybe a couple moving averages to help identify dynamic support and resistance areas and trend. All financial markets generate data about the movement of the price of a market over varying periods of time; this data is displayed on price charts. Price charts reflect the beliefs and actions of all participants (human or computer) trading a market during a specified period of time and these beliefs are portrayed on a market’s price chart in the form of “price action” (P.A.).
Whilst economic data and other global news events are the catalysts for price movement in a market, we don’t need to analyze them to trade the market successfully. The reason is pretty simple; all economic data and world news that causes price movement within a market is ultimately reflected via P.A. on a market’s price chart.
Since a market’s P.A. reflects all variables affecting that market for any given period of time, using lagging price indictors like stochastics, MACD, RSI, and others is just a flat waste of time. Price movement provides all the signals you will ever need to develop a profitable and high-probability trading system. These signals collectively are called price action trading strategiesand they provide a way to make sense of a market’s price movement and help predict its future movement with a high enough degree of accuracy to give you a high-probability trading strategy.
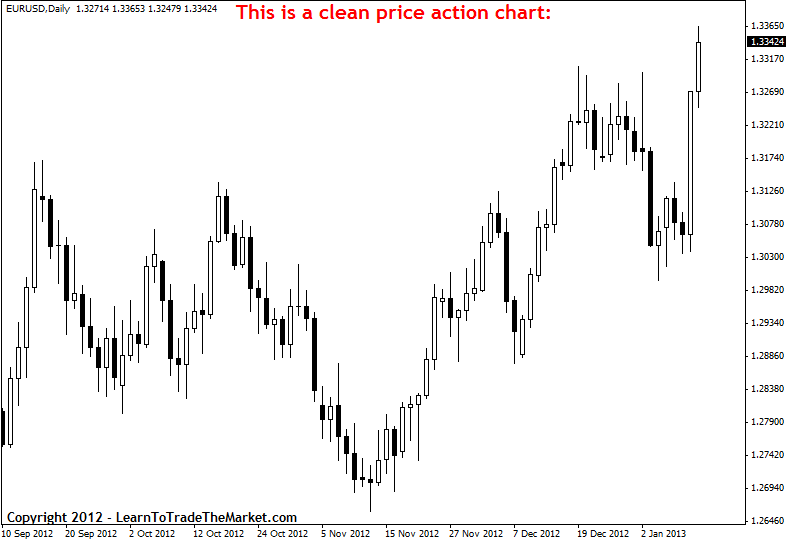
“Clean” Charts vs. “Messy” Indicator-laden Charts
Next, to demonstrate the stark contrast between a pure P.A. chart and one with some of the most popular forex indicators on it, I have shown two charts in the examples below. The chart on the top has no indicators on it, there’s nothing but the raw P.A. of the market on that chart. The bottom chart has MACD, Stochastics, ADX and Bollinger Bands on it; four of the most widely used indicators AKA “secondary” analysis tools as they are sometimes called:
The image example below shows a clean price chart, with no mess, and no indicators, just pure price bars:
The image example below shows a messy price chart, with lots of clutter, indicators and mess:
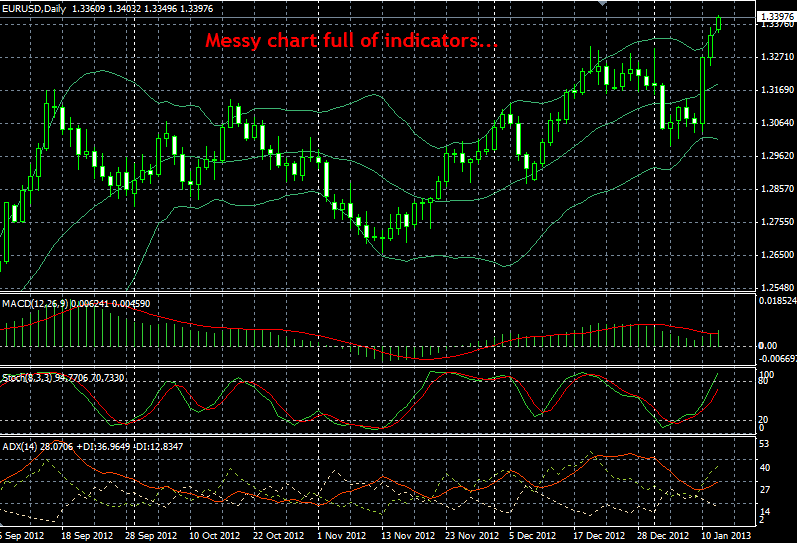
It’s worth pointing out how in the indicator-laden chart you actually have to give up some room on the chart to have the indicators at the bottom, this forces you to make the P.A. part of the chart smaller, and it also draws your attention away from the natural P.A. and onto the indicators. So, not only do you have less screen area to view the P.A., but your focus is not totally on the price action of the market like it should be.
If you really look at both of those charts and think about which one is easier to analyze and trade from, the answer should be pretty clear. All of the indicators on the chart below, and indeed almost all indicators, are derived from the underlying P.A.. In other words, all traders do when they add indicators to their charts is produce more variables for themselves; they aren’t gaining any insight or predictive clues that aren’t already provided by the market’s raw price action.
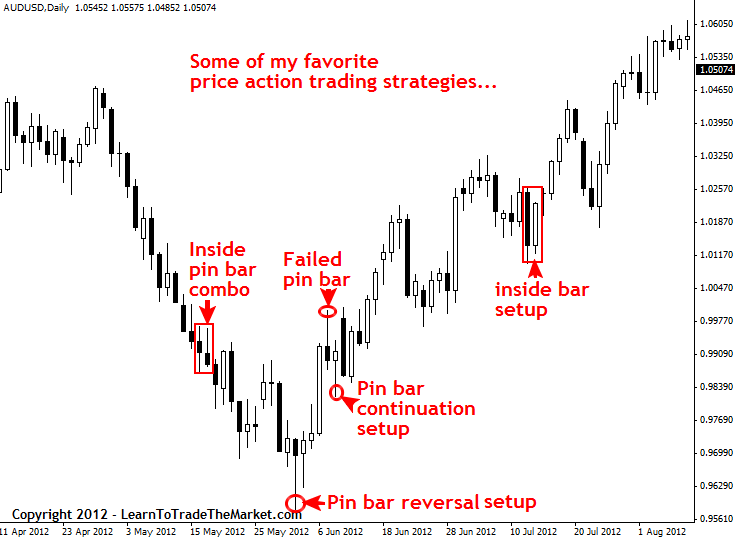
Examples of some of my favorite price action trading strategies:
Next, let’s take a look at some of the price action trading strategies that I teach. Note that I’ve included a “failed” trade setup because not every trade will be a winner; we aren’t here to show you “perfect” past trading results…we are here to teach you in an honest and realistic manner.
In the image example below, we are looking some of my favorite P.A. trading strategies:
How to determine a market’s trend
One of the most important aspects of learning to trade with P.A. is to first learn how to identify atrending market versus a consolidating market. Trading with the trend is highest-probability way to trade and it’s something you HAVE TO learn how to do if you want to stand a chance at making serious money as a trader.
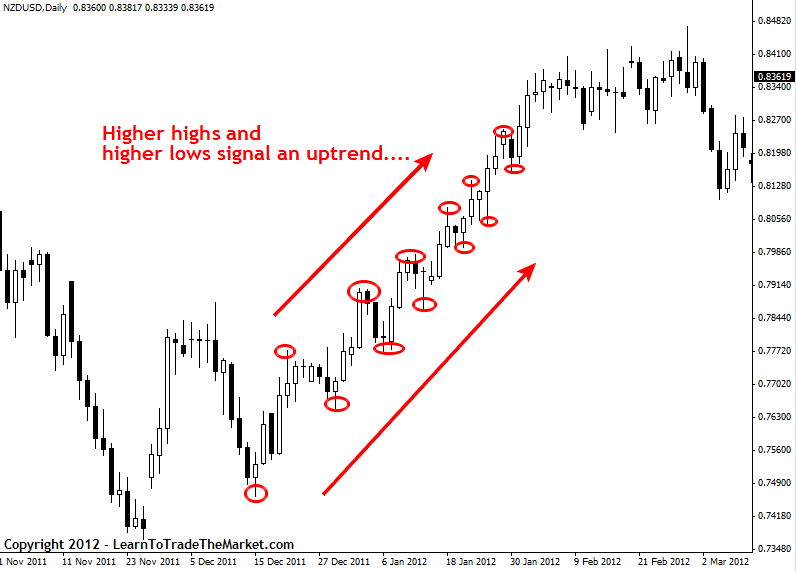
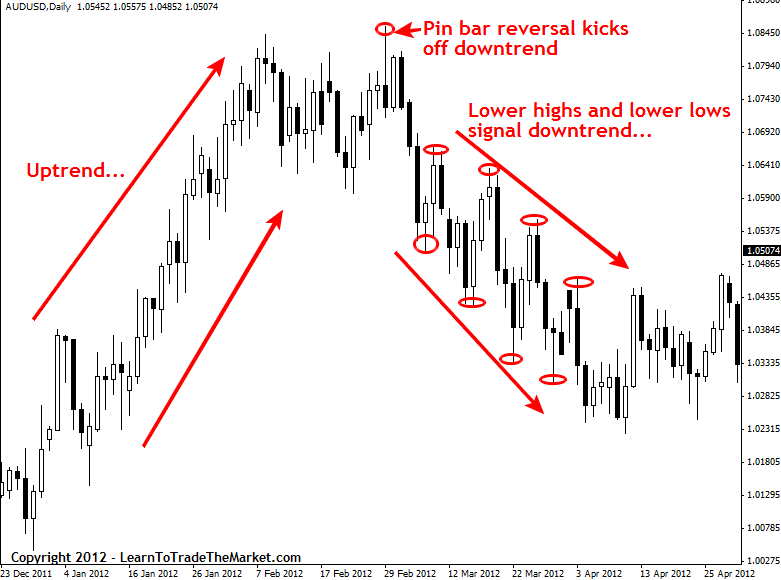
The charts below shows how to use price dynamics to determine a markets trend. We consider a market to be in an uptrend if it is making Higher Highs and Higher Lows (HH, HL) and a downtrend is Lower Highs and Lower Lows (LH, LL).
In the image example below, we can see how higher highs and higher lows signal an up-trend in a market:
In the image example below, we can see how lower highs and lower lows signal a down-trend in a market:
Trending VS. Consolidating markets
As we discussed earlier, P.A.or “price action trading analysis” is the analysis of the price movement of a market over time. From our analysis of price movement we can determine a market’s underlying directional bias or “trend”, or if the market has no trend it is said to be “consolidating”…we can easily determine whether a market is trending or consolidating from simply analyzing its P.A.. We saw how to determine a market’s trend above, to determine if a market is consolidating we just look for an absence of the HH, HL or LH, LL patterns. In the chart below note how the “consolidating price action” is bouncing between a horizontal support and resistance level and is not making HH, HL or LH, LL but is instead going sideways…
The image example below shows a market moving from a consolidation phase to a trending phase:

How to Trade Forex with Price Action Trading Strategies
So how exactly do we trade Forex with price action? It really boils down to learning to trade P.A. setups or patterns from confluent levels in the market. Now, if that sounds new or confusing to you right now, sit tight and I will clarify it soon. First we need to cover a couple more things:
Due to the repetitive nature of market participants and the way they react to global economic variables, the P.A. of a market tends to repeat itself in various patterns. These patterns are also called price action trading strategies, and there are many different price action strategies traded many different ways. These reoccurring price patterns or price action setups reflect changes or continuation in market sentiment. In layman’s terms, that just means by learning to spot price action patterns you can get “clues” as to where the price of a market will go next.
The first thing you should to begin P.A. trading is to take off all the “crap” on your charts. Get rid of the indicators, expert advisors; take off EVERYTHING but the raw price bars of the chart. I prefer to use candlestick charts because I feel they convey the price data of the market more dynamically and “forcefully”, if you are still using classic bar charts and want more info on candlesticks then checkout this candlestick trading tutorial.
I like simple black and white charts the best, as you can see below. In metatrader4 you simply right click on the chart and adjust the “properties” of the chart to get it looking like mine below. If you want more info on how to setup your MT4 trading platform checkout this metatrader 4 tutorial.
After you’ve removed all the indicators and other unnecessary variables from your charts, you can begin drawing in the key chart levels and looking for price action setups to trade from.
The image example below shows examples of some of the trading strategies I teach in my forex trading course. Note the key support / resistance levels have been drawn in:

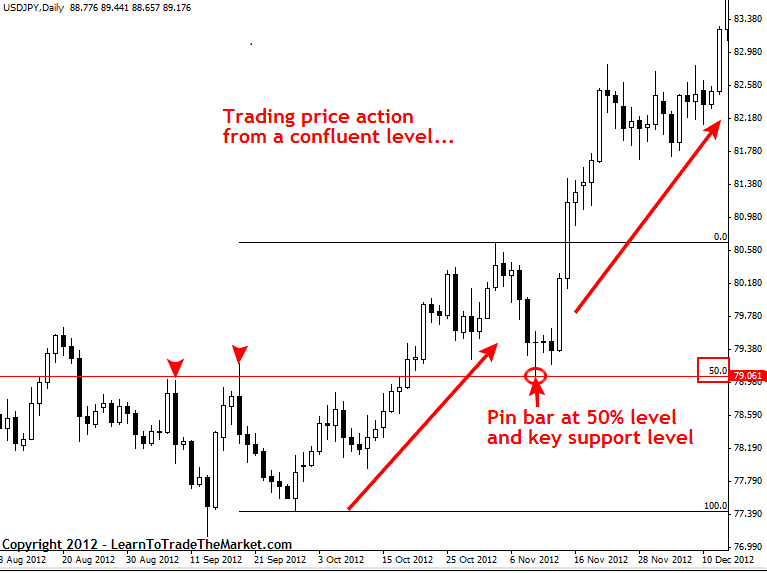
How to trade price action from confluent points in the market:
The next major step in trading Forex P.A. is to draw in the key chart levels and look for confluent levels to trade from. In the chart below we can see that a very obvious and confluent pin bar setup formed in the USDJPY that kicked off a huge uptrend higher. Note that the pin bar trade setup showed rejection of a key horizontal support level as well as the 50% retrace of the last major move, thus the pin bar had “confluence” with the surrounding market structure…
In the image example below, we can see a pin bar setup that formed at a confluent point in the market:
All economic variables create price movement which can be easily seen on a market’s price chart. Whether an economic variable is filtered down through a human trader or a computer trader, the movement that it creates in the market will be easily visible on a price chart. Therefore, instead of trying to analyze a million economic variables each day (this is impossible obviously, although many traders try), you can simply learn to trade price action, because this style of trading allows you to easily analyze and make use of all market variables by simply reading and trading from the P.A. trail they leave behind in a market.
In closing…
I hope today’s introduction to Price Action Forex Trading has been a helpful and enlightening lesson for you. No matter what strategy or system you end up trading with, having a solid understanding of P.A. will only make you a better trader. If you’re like me, and you love simplicity and minimalism, you’ll want to become a “pure” P.A trader and remove all unnecessary variables from your charts. If you’re interested in learning how I trade with simple price action strategies, checkout my Price Action Forex Trading Course for more info.
Good trading, Nial Fuller
=========================================================
Price Action Trading Patterns: Pin Bars, Fakey’s, Inside Bars
In this Forex trading lesson, I am going to share with you three of my favorite price action trading strategies; pin bars, inside bars and fakeys. These trading setups are simple yet very powerful, and if you learn to trade them with discipline and patience you will have a very potent Forex trading edge.
Whilst these three setups are my ‘core’ setups, there are many other versions and variations of them that we focus on in our members’ community and advanced price action trading course. However, you can learn some good basics in this article to lay the foundation for future learning. So, without further delay, let’s get this party started…
Pin Bar Setup:
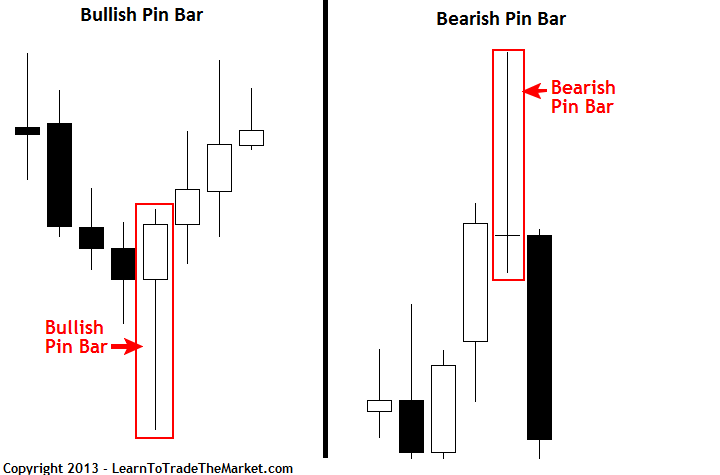
 The pin bar is a staple of the way I trade the Forex market. It has a very high accuracy rate in trending markets and especially when occurring at a confluent level. Pin bars occurring at important support and resistance levels are generally very accurate setups. Pin bars can be taken counter trend as well, as long as they are very well defined and protrude significantly from the surrounding price bars, indicating a strong rejection has occurred, and preferably only on the daily chart time frame. See the illustration to the right for an example of a bearish pin bar (1st bar) and a bullish pin bar (2nd bar) —>
In the following chart example we will take a look at pin bars occurring within the context of a trending market; my favorite way to trade them. Also, note that this uptrend began on the back of two bullish pin bars that brought an end to the existing downtrend.

Fakey Setup:
 The fakey trading strategy is another bread and butter price action setup. It indicates rejection of an important level within the market. Often times the market will appear to be headed one direction and then reverse, sucking all the amateurs in as the professionals push price back in the opposite direction. The fakey setup can set off some pretty big moves in the Forex market.
As we can see in the illustration to the right, the fakey pattern essentially consists of an inside bar–> setup followed by a false break of that inside bar and then a close back within its range. The fakey entry is triggered as price moves back up past the high of the inside bar (or the low in the case of a bearish fakey).
In the chart below we can see the market was recently moving higher before the fakey formed. Note the fakey was formed on the false-break of an inside bar setup that occurred as all the amateurs tried to pick the market top, the pros then stepped in and flushed out all the amateurs in a flurry of buying…

Inside Bar Setup:
 The inside bar is a great trend continuation signal, but it can also be used as a turning point signal. However, the first way to learn how to trade the inside bar strategy is as a continuation signal, so that is what we will focus on here, more info on the inside bar and all the ways to trade it can be found in my advancedprice action trading course. As we can see in the illustration to the right, an inside bar is completely contained within the range of–> the previous bar
It shows a brief consolidation and then a break out in the dominant trend direction. Inside bars are best played on daily and weekly charts. They allow for very small risks and yet very large rewards. The inside bar strategy combined with a very strongly trending market is one of my favorite price action setups.
In the example below, we are looking at a current (as of this writing) EURUSD inside bar trade setup that has come off to the downside with the existing bearish market momentum. We can see a nice inside bar setup formed just after the market broke down below a key support level, the setup has since come off significantly lower and is still falling towards the next support at 1.2625, as of this writing. Many of our members are in on this trade as we’ve discussed it extensively in both the members forum and the daily member’s commentary.

As you can see from the three examples above, Forex trading does not have to be complicated or involve plastering messy and confusing indicators all over your charts. Once you master a few solid price action setups like the ones above and the others in my Forex trading course, you will be well on your way to becoming a more confident and profitable trader, just remember, mastering these setups will require patience, dedication and discipline.
Want More Trade Setups ? I publish a members only daily trade setups newsletter which includes analysis on Forex, Indices and Commodities. For more info Click Here.
Special Note - During October Get 30% Off Life-Time Membership To Nial's Forex Courses, Daily Trade Setups Newsletter, Live Trading Forum & Email Support Line - Click Here.
Pin Bar Forex Trading Strategy – Pin Bar Definition
 An Introduction To The Pin Bar Forex Trading Strategy and How to Trade It Effectively…
The pin bar formation is a price action reversal pattern that shows that a certain level or price point in the market was rejected. Once familiarized with the pin bar formation, it is apparent from looking at any price chart just how profitable this pattern can be. Let’s go over exactly what a pin bar formation is and how you can take advantage of the pin bar strategy in the context of varying market conditions.
What is a Pin Bar?
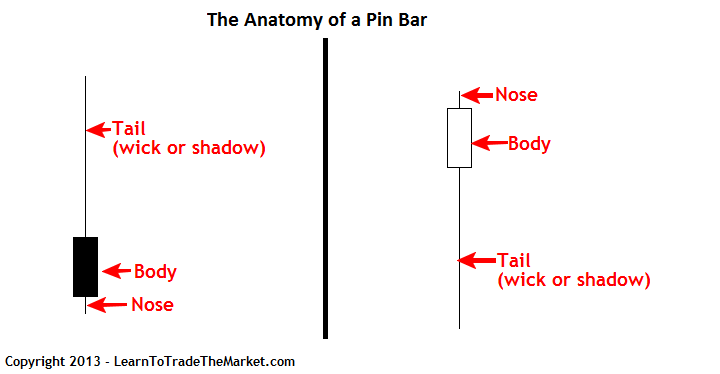
The actual pin bar itself is a bar with a long upper or lower “tail”, “wick” or “shadow” and a much smaller “body” or “real body”, you can find pin bars on any stripped-down, “naked” bar chart or candlestick chart. We use candlestick charts because they show the price action the clearest and are the most popular charts amongst professional traders. Many traders prefer the candlestick version over standard bar charts because it is generally regarded as a better visual representation of price action.
Characteristics of the Pin Bar Formation
• The pin bar should have a long upper or lower tail…the tail is also sometimes called the “wick” or the “shadow”…they all mean the same thing. It’s the “pointy” part of the pin bar that literally looks like a “tail” and that shows rejection or false break of a level.
• The area between the open and close of the pin bar is called the “body” or “real body”. It is typically colored white or another light color when the close was higher than the open and black or another dark color when the close was lower than the open.
• The open and close of the pin bar should be very close together or equal (same price), the closer the better.
• The open and close of the pin bar are near one end of the bar, the closer to the end the better.
• The shadow or tail of the pin bar sticks out (protrudes) from the surrounding price bars, the longer the tail of the pin bar the better.
• A general “rule of thumb” is that you want to see the pin bar tail be two/thirds the total pin bar length or more and the rest of the pin bar should be one/third the total pin bar length or less.
• The end opposite the tail is sometimes referred to as the “nose”
Bullish Reversal Pin Bar Formation
In a bullish pin bar reversal setup, the pin bar’s tail points down because it shows rejection of lower prices or a level of support. This setup very often leads to a rise in price.
Bearish Reversal Pin Bar Formation
In a bearish pin bar reversal setup, the pin bar’s tail points up because it shows rejection of higher prices or a level of resistance. This setup very often leads to a drop in price.
Examples of the Pin Bar Formation in Action
Here is a daily chart of CAD/JPY, we can see numerous pin bar formations that were very well defined and worked out very nicely. Note how all the pin bar’s tails clearly protruded from the surrounding price action, showing a defined “rejection” of lower prices. All of the pin bars below have something in common that we just discussed, can you guess what it is?

If you said that all the pin bars in the above chart are “bullish pin bar setups”, then you answered the question right. Good job!
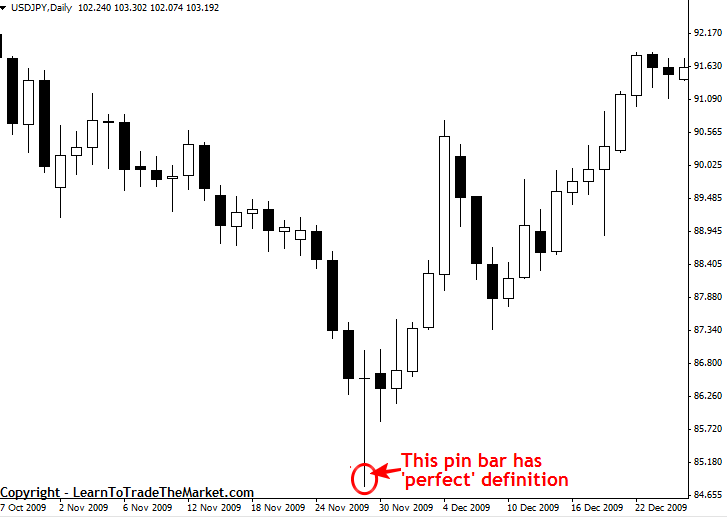
In the following daily USD/JPY chart we can see an ideal pin bar formation that resulted in a serious move and trend reversal. Sometimes pin bars like this form at significant market turning points and change the trend very quickly, like we see below. The example in the chart below is also sometimes called a “V bottom reversal”, because the reversal is so sharp it literally looks a V…
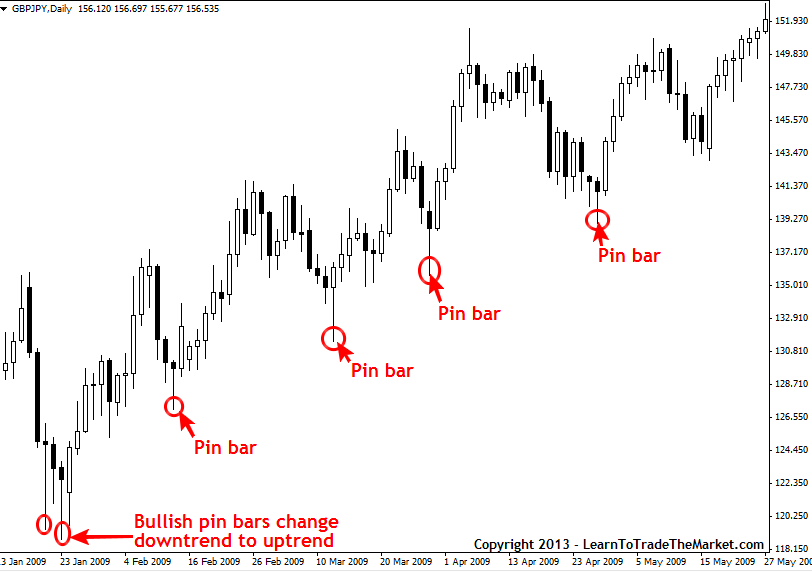
Here is an example of a trending market that formed numerous profitable pin bar setups. The following daily chart of GBP/JPY shows that pin bars taken with the dominant trend can be very accurate. Note the two pin bars on the far left of the chart that marked the start of the uptrend and then as the trend progressed we had numerous high-probability opportunities to buy into it from the bullish pin bars shown below that were in-line with the uptrend.
How to Trade a Pin Bar Formation
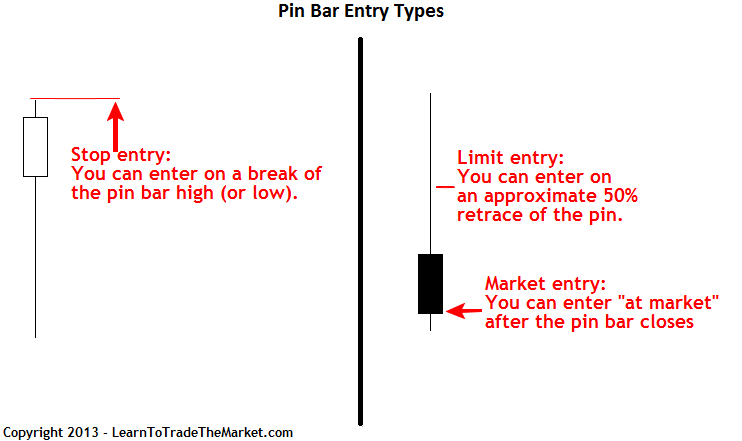
The pin bar formation is a reversal setup, and we have a few different entry possibilities for it:
“At market entry” – This means you place a “market” order which gets filled immediately after you place it, at the best “market price”. A bullish pin would get a “buy market” order and a bearish pin a “sell market” order.
“On stop entry” – This means you place a stop entry at the level you want to enter the market. The market needs to move up into your buy stop or down into your sell stop to trigger it. It’s important to note that a sell stop order must be under the current market price, including the spread, and a buy stop order must be above the current market price, including the spread. If you need more help on these “jargon” words checkout my free beginners forex course for more. On a bullish pin bar formation, we will typically buy on a break of the high of the pin bar and set our stop loss 1 pip below the low of the tail of the pin bar. On a bearish pin bar formation, we will typically sell on a break of the low of the pin bar and place a stop loss 1 pip above the tail of the pin bar. There are other stop loss placements for my various setups taught in my advanced price action course.
“Limit entry” – This entry must be placed above the current market price for a sell and below the current market price for a buy. The basic idea is that some pin bars will retrace to around 50% of the tail, so we can look to enter there with a limit order. This provides a tight stop loss with our stop loss just above or below the pin bar high or low and a large potential risk reward on the trade as a result.
To effectively trade the pin bar formation you need to first make sure it is well-defined, (see pin bar characteristics listed at the top of this tutorial). Not all pin bar formations are created equal; it pays to only take the pin bar formations that meet the above characteristics.
Next, try to only take take pin bars that are displaying confluence with another factor. Generally, pin bars taken with the dominant daily chart trend are the most accurate. However, there are many profitable pin bars that often occur in range-bound markets or at major market turning points as well. Examples of “factors of confluence” include but are not limited to: strong support and resistance levels, Fibonacci 50% retracement levels, or moving averages.
Pin bar in range-bound market and at important market turning point (trend change):
In the chart example below, we can see a bearish pin bar sell signal that formed at a key level of resistance in the EURUSD. This was a good pin bar because it’s tail was clearly protruding up through the key resistance and from the surrounding price action, indicating that a strong rejection as well as false-break of an important resistance had taken place. Thus, there was a high probability of a move lower after that pin bar. Note the 50% limit sell entry that presented itself as the next bar retraced to about 50% of the pin bar’s length before the market fell significantly lower…

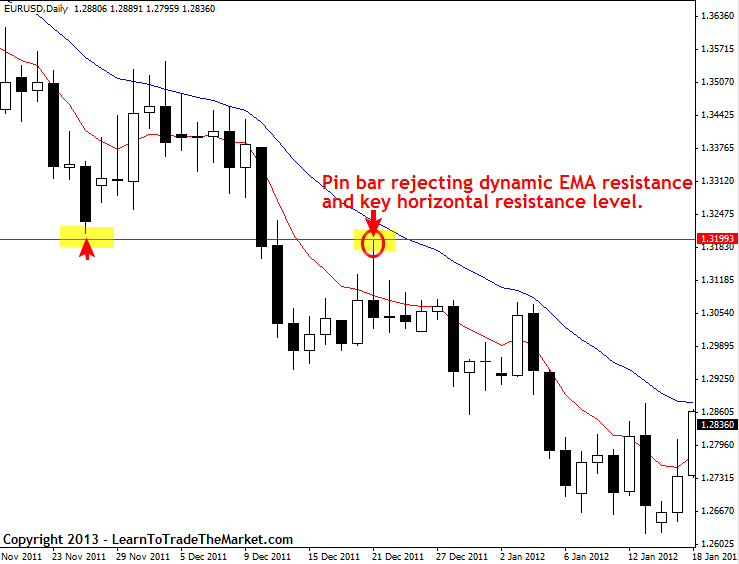
Pin bar in-line with trend with multiple factors of confluence:
In the chart example below, we are looking at a bearish pin bar sell signal that formed in the context of a down-trending market and from a confluent area in the market. The confluence between the 8 / 21 dynamic EMA resistance layer, the horizontal resistance at 1.3200 and the downtrend, gave a lot of “weight” to the pin bar signal. When we get a well-defined pin bar like this, that has formed at a confluent area or level in the market like this, it’s a very high-probability setup…
Other names you might find pin bars described by:
There are several different names used in ‘classic’ Japanese candlestick patterns that refer to what are basically all pin bars, the terminology is just a little different. The following all qualify as pin bars and can be traded as I’ve described above:
• A bearish reversal or top reversal pin bar formation can be called a “long wicked inverted hammer”, “long wicked doji”, “long wicked gravestone”, or “shooting star”.
• A bullish reversal or bottom reversal pin bar formation can be called a “long wicked hammer”, “long wicked doji”, or “long wicked dragonfly”.
In Summary
The pin bar formation is a very valuable tool in your arsenal of Forex price action trading strategies. The best pin bar strategies occur with a confluence of signals such as support and resistance levels, dominant trend confirmation, or other ‘confirming’ factors. Look for well formed pin bar setups that meet all the characteristics listed in this tutorial and don’t take any that you don’t feel particularly confident about.
Pin bars work on all time frames but are especially powerful on the 1 hour, 4hour and daily chart time frames. It is possible to make consistent profits by only trading the pin bar formation, and you can learn more about it in my price action trading course. Upon adding this powerful setup as one of your main Forex trading strategies, you will wonder how you ever traded without it.
Special Note - During October Get 30% Off Life-Time Membership To Nial's Forex Courses, Daily Trade Setups Newsletter, Live Trading Forum & Email Support Line - Click Here.
Hiç yorum yok:
Yorum Gönder